Our client operates within a dynamic and competitive service industry. With a focus on transparency and accountability, the client seeks to empower stakeholders at all levels with actionable insights derived from graphical representations of support case data.
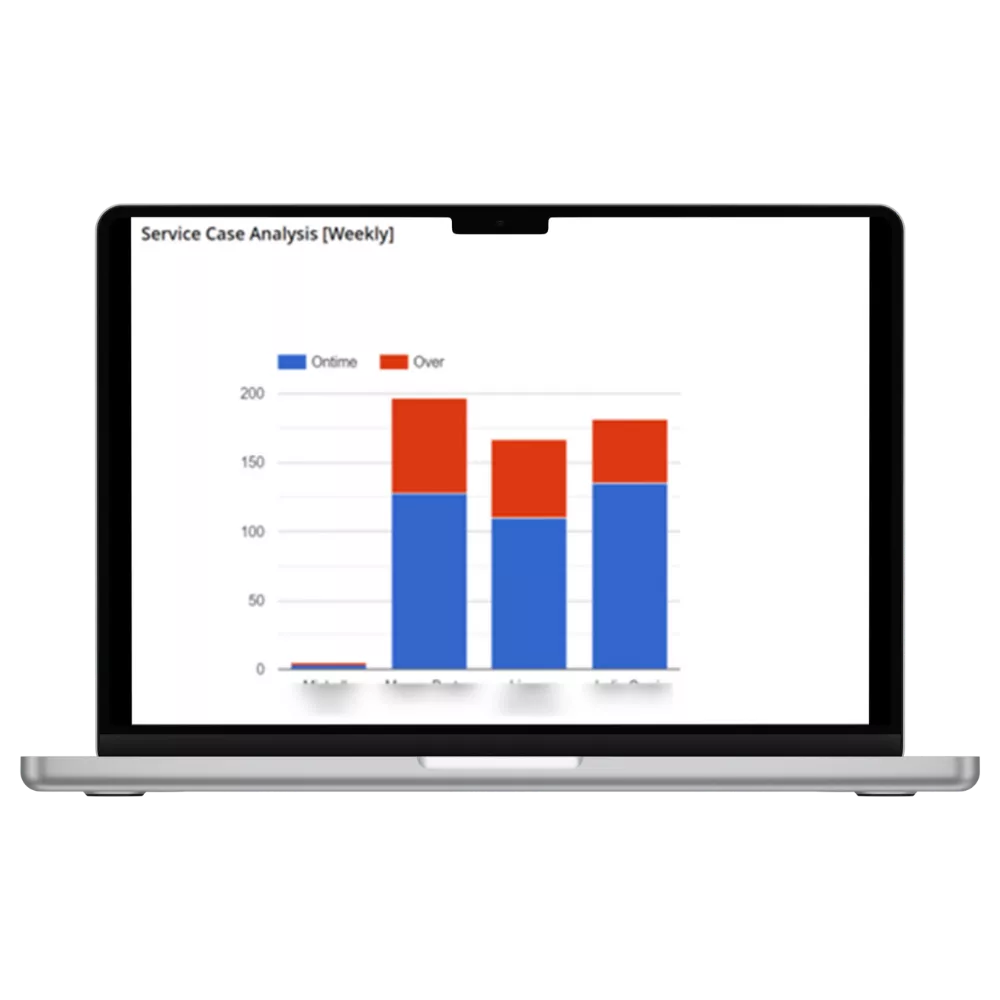
By leveraging the Google Matrix API and JavaScript, we successfully designed a dynamic chart to visualize support case resolution success ratios by each employee.
Our solution enabled stakeholders to gain valuable insights into employee performance and drive improvements in support operations.
Requirements
Client needs to monitor and analyse support case resolution metrics to ensure optimal service delivery. Specifically, there was a requirement to visualize the support case resolution success ratio for each employee to identify performance trends.
Graphical representation of analysed support case data is which help stack holder to take precise and quick decisions is the main goal.
Development Approach
Client adopted a development approach cantered around utilizing the Google Matrix API and JavaScript to design a dynamic chart. The chart would effectively represent the support case resolution success ratio by each employee over a specified period.
Challenges
User Interface Design: Designing an intuitive interface for the chart presented a design was big challenge, as NetSuite doesn’t provide any module to prepare graphical report or portlet.
Real-Time Updates: Ensuring that the chart provided real-time updates and dynamic visualization of support case resolution metrics posed a technical challenge. Because gathering big amount of data connected with various entity at a time is big challenge.
Our Solution
We implemented multi-level saved search mechanisms including custom formula to extract support case resolution data. This data was processed and formatted for compatibility with the Google Matrix API.
We leveraged the capabilities of the Google Matrix API and JavaScript to create a dynamic chart interface. Suitelet help us to fetch all require data from saved search and feed google matrix API. This interface fetched real-time data and generated visualizations of support case resolution success ratios by each employee.
We focused on creating an intuitive and visually appealing user interface for the chart.
“Our mission is to empower individuals and organizations to navigate the digital world with confidence and peace of mind.”
Kaushik Karia
Co-Founder & CEO
Let us know how we can help with your next project?
Embark on your next project with confidence as EcobSoft stands ready to be your strategic partner. Our seasoned team of experts is dedicated to providing end-to-end support, from project conceptualization to seamless execution. With a proven track record in delivering innovative solutions, tailored to your unique needs, we bring a dynamic approach to every endeavor.